If you are a student of Statistics, Business Studies or Finance, you can be asked to write the assignments like BUS5SBF. It is a subject code in which you are required to answer a few questions as a part of your assignment. The approaches given by the subject matter experts can help you in designing your assignment.

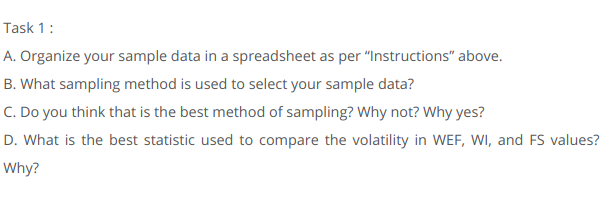
In order to answer the above question, you are required to organise the data as per the given guideline. After this, use the Simple Random Sampling method to collect the sample from the households for the above question. You can also use the descriptive statistics to compare the volatility in WI, WEF and FS.

Approach For The Task 2 Of BUS5SBF business and finance assessment
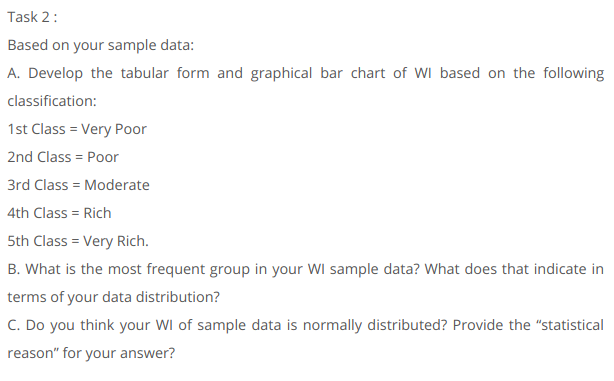
Once you conduct a sample data, you are required to develop a graphical bar chart and tabular chart of WI which will be on the basis of the following:
1st Class = Very Poor
2nd Class= Poor
3rd Class= Moderate
4th Class= Rich
5th Class= Very Rich
The frequency distribution for the above table will be like
| Weekly Income | Frequency | Percentage |
| Very Poor | 74 | 74% |
| Poor | 15 | 15% |
| Moderate | 6 | 6% |
| Rich | 3 | 3% |
| Very Rich | 2 | 2% |
| Total | 100 |
After this, you are required to find the most frequent group in WI sample data and what it says in terms of data distribution. Also, find out that the data sample of WI has distributed normally. You are also required to support your answer by a statistical reason.

In the above question, you must have to answer the question given above. For part A, you are required to determine the top 10% and bottom 10% of WEF household values. For this, you are required to arrange the data in ascending order of magnitude.
For Part B, find the probability assuming that W values are less than or equal to $200. If you find any difficulty in calculating probability or answering the further part of task 2, simply take help by BUS5SBF business and finance assignment sample.

Follow The Following Approach To Solve Task 4 Of BUS5SBF Business And Finance Assessment
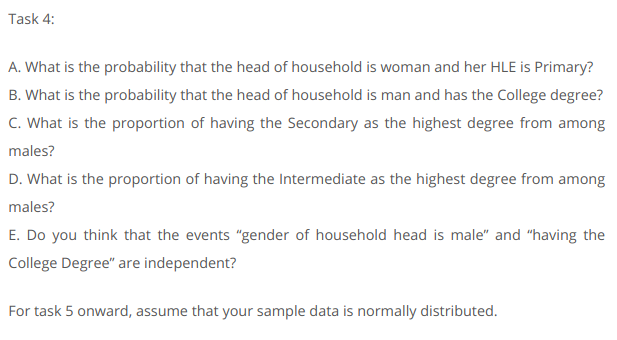
The assignment experts have created a cross tabulation table which displays the association between HLE and head of household. The table may look like -
| Family Head/HLE | C | G | I | P | S | Grand Total |
| F | 1 | 2 | 36 | 3 | 42 | |
| M | 3 | 4 | 2 | 11 | 38 | 58 |
| Grand Total | 3 | 5 | 4 | 47 | 41 | 100 |
After this, they opt to answer the questions given in the task on the basis of the above data.
Apart from the above questions/ tasks, there are few more tasks which need to be completed during attempting the assignment but we have less space to go about.
More details about BUS5SBF business and finance assignment can be grabbed from Online Assignment Expert. If you are a student of business or finance assignment and need assistance in writing your assignment, visit www.onlineassignment-expert.com. Here, a pool of certified and talented academic writers who have drafted more than thousands of BUS5SBF business and finance assignment sample for university students.
Get
500 Words Free
on your assignment today